WARMING UP
Week of February 12th, 2017
OVERVIEW – “SNOW” DEMO BY THE NUMBERS
This is going to be a different retrospective than usual.
A little over a week ago I released the first major (albeit super early) demo of Village Monsters, and I wanted to take today to break down some of the numbers. This might be only interesting to me, or maybe it’ll interest other folks who want to know about the nitty-gritter of running a game business.

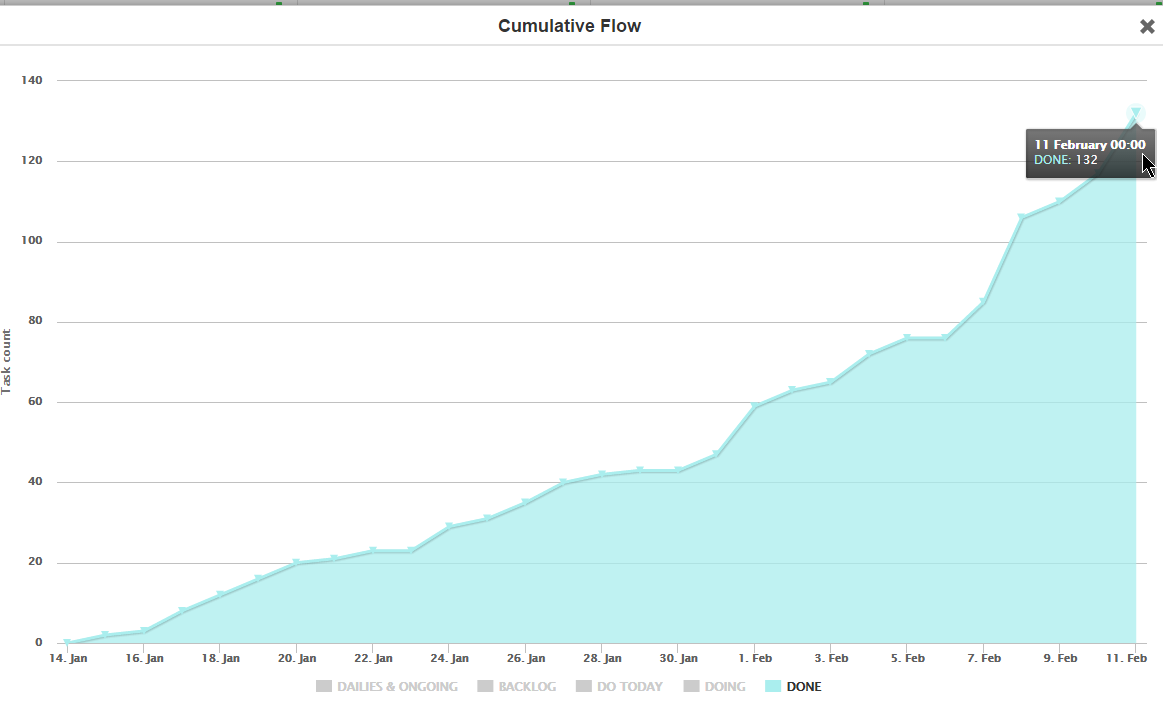
First up is the Cumulative Flow chart – this graph shows you how many tasks were completed (put into “Done”) on each day. By the end of our 28 day cycle we ended up with 132 tasks completed for the Snow release.
Is that a lot or a little? I’m actually not sure yet, as it’s my first measurement of such a metric. I know for a fact that I wasn’t always so diligent at tagging my tasks correctly, so I’m sure I missed at least a few of them. We’ll have to see where the next release, Crow, takes us

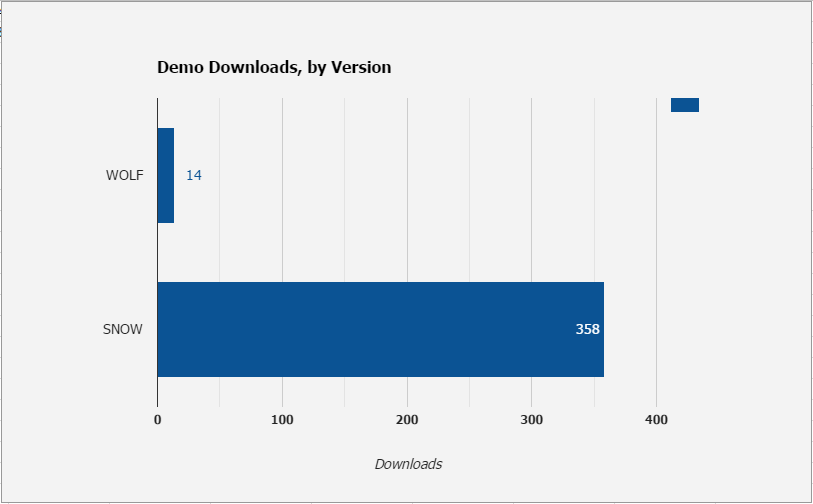
Next up, we have the amount of times the demo was downloaded. In total, the file was downloaded 358 times.
I am ecstatic about this number. My marketing “strategy” – such that it is – has been to be as minimally invasive as possible. As a consumer, I’ve been subjected to enough garbage and slimy tactics by companies that I know exactly what I don’t want to do.
I’m not so naive as to think such a relatively low number is any sort of indicator of success, but it is perhaps a sign that my strategies aren’t failing, at least. Over time, perhaps I can find success my own way
![]()
Finally, we arrive to what is probably the most useless metric – time spent with my IDE open. I’m frequently leaving it open while doing other things (like writing this post!) so it’s very misleading, but still…5 days? >120 hours? Wow. That’s, uh, that’s a lot!
SHOW & TELL


Leave a Reply
You must be logged in to post a comment.